Application Portfolio.puml
Applications sized by spend, grouped by domain.
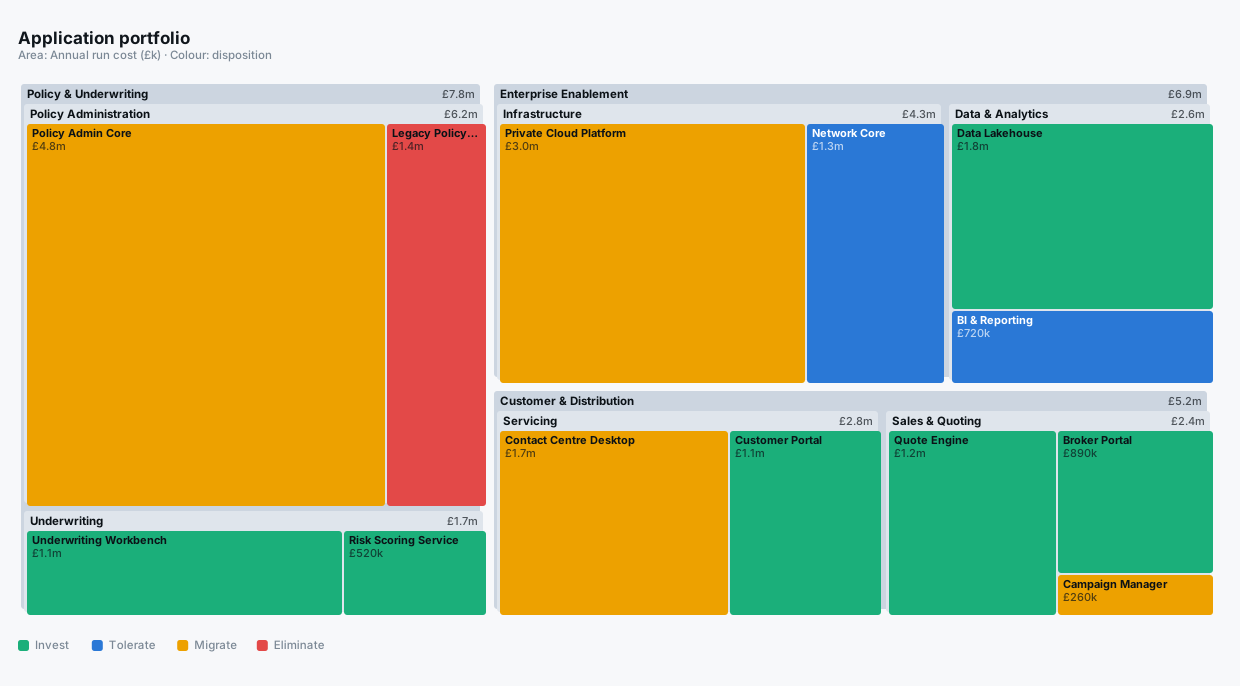
Show the source
@startea
Title("Application portfolio")
Measure(cost, "Annual run cost", "£k")
Size(cost)
Colour(disposition)

Capability(cust, "Customer & Distribution") {
  Capability(sales, "Sales & Quoting") {
    App("Quote Engine", cost=1240, disposition=invest, crit=5, health=4)
    App("Broker Portal", cost=890, disposition=invest, crit=4, health=4)
    App("Campaign Manager", cost=260, disposition=migrate, crit=2, health=2)
  }
  Capability(svc, "Servicing") {
    App("Customer Portal", cost=1120, disposition=invest, crit=5, health=4)
    App("Contact Centre Desktop", cost=1680, disposition=migrate, crit=5, health=2)
  }
}

Capability(policy, "Policy & Underwriting") {
  Capability(admin, "Policy Administration") {
    App("Policy Admin Core", cost=4820, disposition=migrate, crit=5, health=1)
    App("Legacy Policy Ledger", cost=1360, disposition=eliminate, crit=4, health=1)
  }
  Capability(uw, "Underwriting") {